Circle Footprint Filter Demo
A demonstration validating the PPCircleFootprint filter.
[1]:
import pandas as pd
import sqlite3 as sql
import matplotlib.pyplot as plt
from astropy.coordinates import SkyCoord
[2]:
from sorcha.modules.PPApplyFOVFilter import PPCircleFootprint, PPGetSeparation
We begin by loading in a set of randomised artificial observations which were all generated to lie on the same field, within 2.1 degrees of field centre.
[3]:
def get_sql_data(database, rows_start, nrows):

    con = sql.connect(database)
    observations = pd.read_sql("""SELECT observationId, observationStartMJD as observationStartMJD_TAI, visitTime, visitExposureTime, filter, seeingFwhmGeom as seeingFwhmGeom_arcsec, seeingFwhmEff as seeingFwhmEff_arcsec, fiveSigmaDepth as fieldFiveSigmaDepth_mag , fieldRA as fieldRA_deg, fieldDec as fieldDec_deg, rotSkyPos as fieldRotSkyPos_deg FROM observations order by observationId LIMIT """ + str(rows_start) + ',' + str(nrows), con)

    return observations
[4]:
def get_separation(obj_RA, obj_Dec, cen_RA, cen_Dec):

    obj_coord = SkyCoord(ra=obj_RA, dec=obj_Dec, unit="deg")
    cen_coord = SkyCoord(ra=cen_RA, dec=cen_Dec, unit="deg")

    sep = obj_coord.separation(cen_coord)

    return sep.degree
[5]:
db_path = "oneline_v2.0.db"
LSSTdf = get_sql_data(db_path, 0,1)
[6]:
LSSTdf
[6]:
| observationId | observationStartMJD_TAI | visitTime | visitExposureTime | filter | seeingFwhmGeom_arcsec | seeingFwhmEff_arcsec | fieldFiveSigmaDepth_mag | fieldRA_deg | fieldDec_deg | fieldRotSkyPos_deg | |
|---|---|---|---|---|---|---|---|---|---|---|---|
| 0 | 402942 | 60945.035513 | 34.0 | 30.0 | r | 0.750259 | 0.849464 | 24.071162 | 273.428988 | -24.927018 | 182.732823 |
[7]:
dfobs = pd.read_csv("footprintFilterValidationObservations.csv", sep='\s+')
[8]:
dfobs = pd.merge(dfobs, LSSTdf, left_on="FieldID", right_on="observationId", how="left")
[9]:
dfobs
[9]:
| ObjID | FieldID | fieldMJD_TAI | Range_LTC_km | RangeRate_LTC_km_s | RA_deg | RARateCosDec_deg_day | Dec_deg | DecRate_deg_day | Obj_Sun_x_LTC_km | ... | observationStartMJD_TAI | visitTime | visitExposureTime | filter | seeingFwhmGeom_arcsec | seeingFwhmEff_arcsec | fieldFiveSigmaDepth_mag | fieldRA_deg | fieldDec_deg | fieldRotSkyPos_deg | |
|---|---|---|---|---|---|---|---|---|---|---|---|---|---|---|---|---|---|---|---|---|---|
| 0 | S0000w6ca | 402942.0 | 60945.035513 | 344266000.0 | 9.645862 | 273.950475 | 0.145419 | -25.409570 | -0.034414 | 171050400.0 | ... | 60945.035513 | 34.0 | 30.0 | r | 0.750259 | 0.849464 | 24.071162 | 273.428988 | -24.927018 | 182.732823 |
| 1 | S0000wkZa | 402942.0 | 60945.035513 | 93728970.0 | 24.810874 | 273.029493 | 1.592210 | -24.398177 | -0.243588 | 154138100.0 | ... | 60945.035513 | 34.0 | 30.0 | r | 0.750259 | 0.849464 | 24.071162 | 273.428988 | -24.927018 | 182.732823 |
| 2 | S0000wspa | 402942.0 | 60945.035513 | 330569600.0 | 21.915557 | 274.480023 | 0.072605 | -25.283050 | 0.093505 | 172974700.0 | ... | 60945.035513 | 34.0 | 30.0 | r | 0.750259 | 0.849464 | 24.071162 | 273.428988 | -24.927018 | 182.732823 |
| 3 | S0000wUea | 402942.0 | 60945.035513 | 492613400.0 | 25.078801 | 273.646543 | 0.109090 | -25.456436 | 0.005462 | 177915900.0 | ... | 60945.035513 | 34.0 | 30.0 | r | 0.750259 | 0.849464 | 24.071162 | 273.428988 | -24.927018 | 182.732823 |
| 4 | S0000xl3a | 402942.0 | 60945.035513 | 200278800.0 | 30.796080 | 271.853254 | 0.734379 | -23.453650 | -0.003425 | 155568800.0 | ... | 60945.035513 | 34.0 | 30.0 | r | 0.750259 | 0.849464 | 24.071162 | 273.428988 | -24.927018 | 182.732823 |
| ... | ... | ... | ... | ... | ... | ... | ... | ... | ... | ... | ... | ... | ... | ... | ... | ... | ... | ... | ... | ... | ... |
| 29051 | mpc00K8271 | 402942.0 | 60945.035513 | 360725700.0 | 20.617454 | 272.594036 | 0.244908 | -25.480627 | 0.015066 | 164365000.0 | ... | 60945.035513 | 34.0 | 30.0 | r | 0.750259 | 0.849464 | 24.071162 | 273.428988 | -24.927018 | 182.732823 |
| 29052 | mpc00K9056 | 402942.0 | 60945.035513 | 261587100.0 | 16.465273 | 272.172454 | 0.412457 | -25.517282 | 0.032230 | 158575700.0 | ... | 60945.035513 | 34.0 | 30.0 | r | 0.750259 | 0.849464 | 24.071162 | 273.428988 | -24.927018 | 182.732823 |
| 29053 | mpc00K9551 | 402942.0 | 60945.035513 | 298658200.0 | 16.740250 | 274.477149 | 0.288844 | -26.376947 | 0.009252 | 170513400.0 | ... | 60945.035513 | 34.0 | 30.0 | r | 0.750259 | 0.849464 | 24.071162 | 273.428988 | -24.927018 | 182.732823 |
| 29054 | mpc00K9617 | 402942.0 | 60945.035513 | 371087000.0 | 21.670828 | 272.019401 | 0.241333 | -24.188684 | 0.022293 | 161555100.0 | ... | 60945.035513 | 34.0 | 30.0 | r | 0.750259 | 0.849464 | 24.071162 | 273.428988 | -24.927018 | 182.732823 |
| 29055 | mpc00K9664 | 402942.0 | 60945.035513 | 252349900.0 | 18.731995 | 275.385502 | 0.430778 | -25.443011 | 0.025301 | 171014400.0 | ... | 60945.035513 | 34.0 | 30.0 | r | 0.750259 | 0.849464 | 24.071162 | 273.428988 | -24.927018 | 182.732823 |
29056 rows × 35 columns
We can roughly plot the distance from the field centre in RA and Dec.
[10]:
fig, ax = plt.subplots(1, figsize=(10,10))
ax.scatter(dfobs['fieldRA_deg']-dfobs['RA_deg'],dfobs['fieldDec_deg']-dfobs['Dec_deg'], s=0.1, color='darkorchid')
ax.set_ylabel('distance from field centre RA (deg)')
ax.set_xlabel('distance from field centre Dec (deg)')
plt.show()
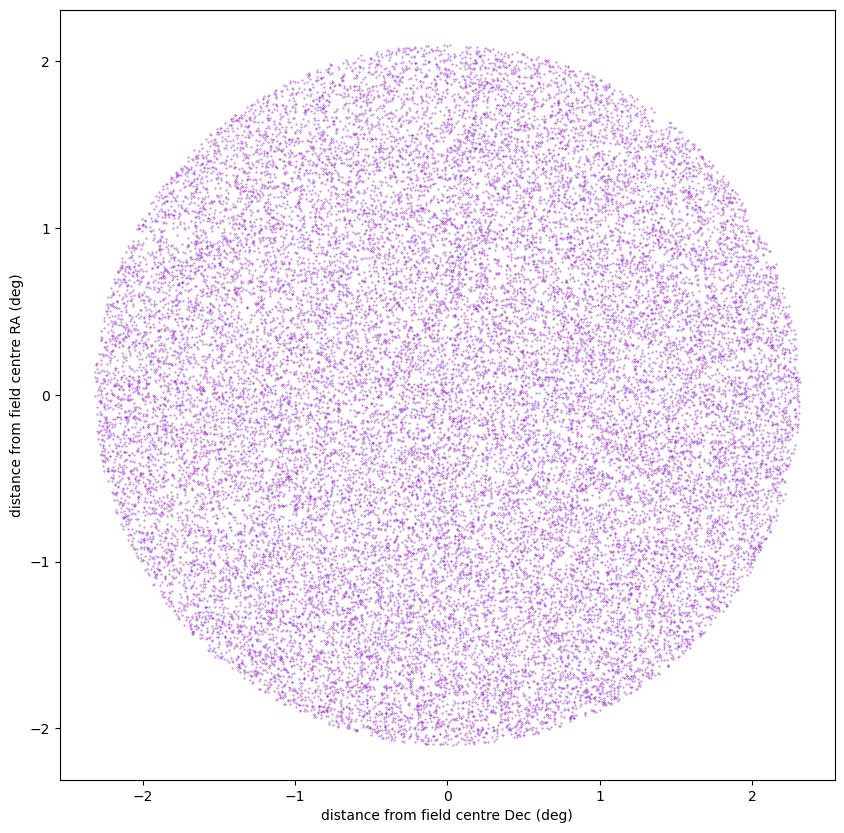
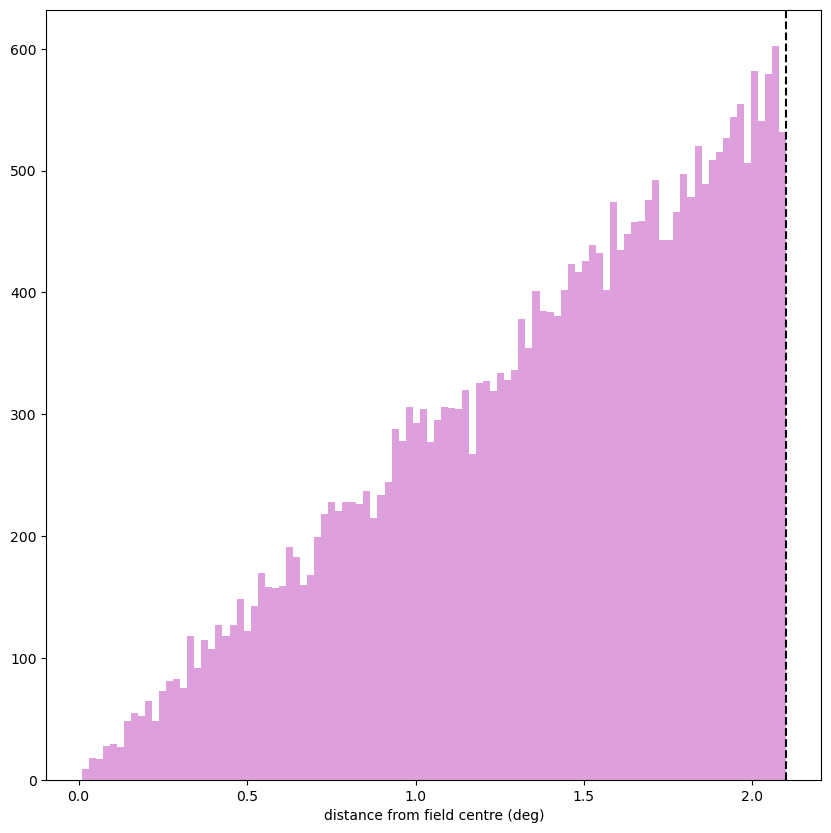
As can be seen, all of these observations lie on a circle of radius 2.3 degrees. We can also plot this as a histogram.
[11]:
object_sep = get_separation(dfobs['RA_deg'].values,
                            dfobs['Dec_deg'].values,
                            dfobs['fieldRA_deg'].values,
                            dfobs['fieldDec_deg'].values)
[12]:
fig, ax = plt.subplots(1, figsize=(10,10))
_ = ax.hist(object_sep, 100, color='plum')
ax.axvline(2.1, color='black', linestyle='--')
ax.set_xlabel('distance from field centre (deg)')
plt.show()
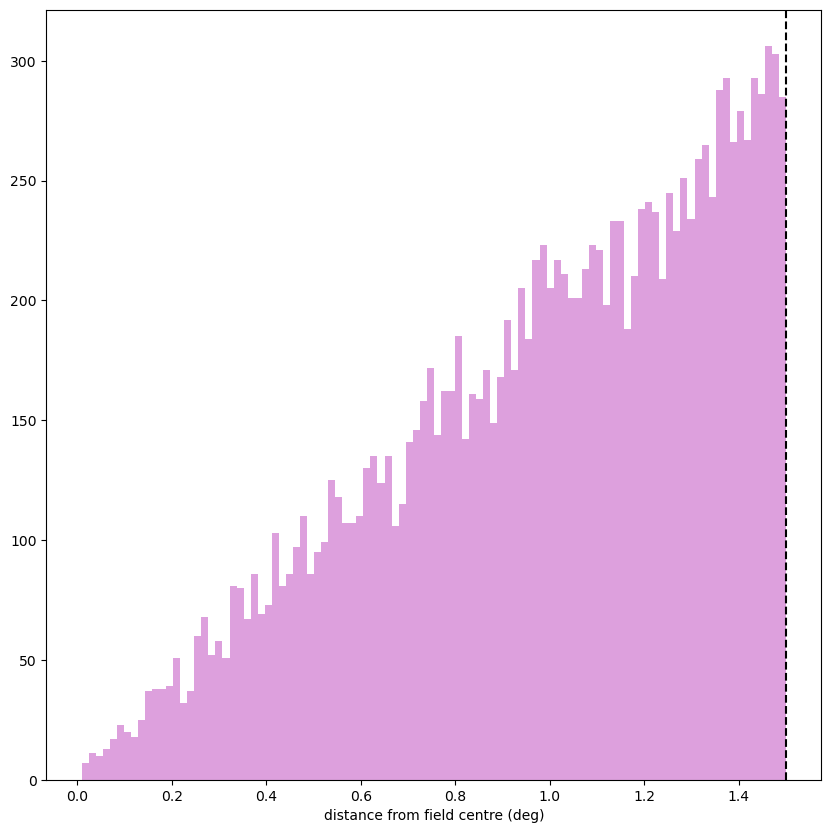
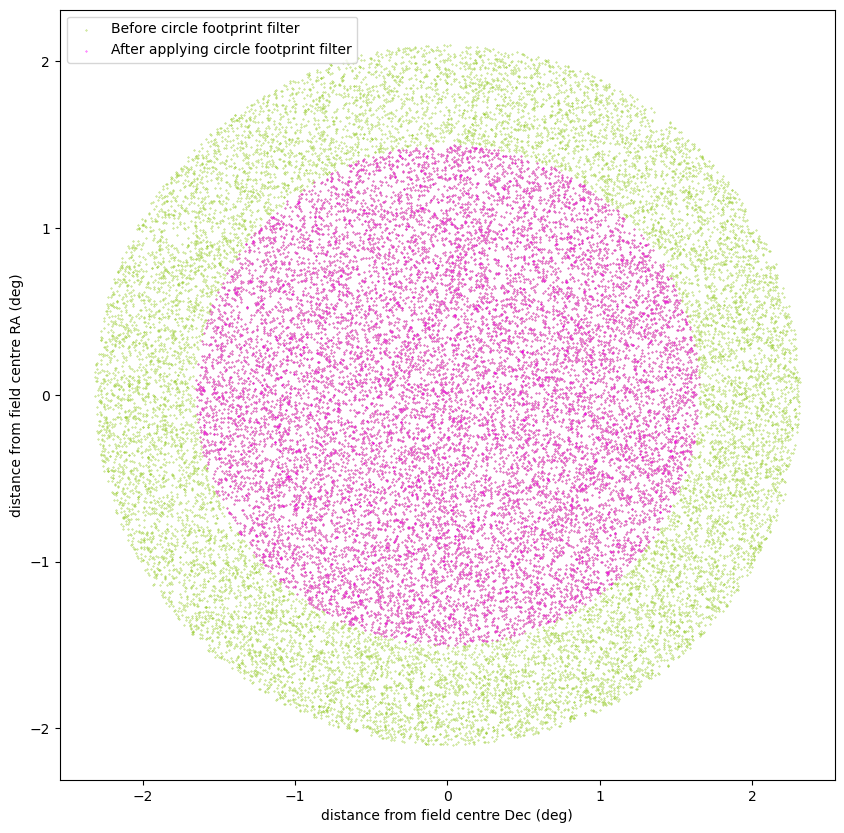
Now we apply the circle footprint filter with a radius of 1.5 degrees.
[13]:
obs_new = PPCircleFootprint(dfobs, 1.5)
[14]:
fig, ax = plt.subplots(1, figsize=(10,10))
ax.scatter(dfobs['fieldRA_deg']-dfobs['RA_deg'],dfobs['fieldDec_deg']-dfobs['Dec_deg'], s=0.1, color='YellowGreen', label='Before circle footprint filter')
ax.scatter(obs_new ['fieldRA_deg']-obs_new ['RA_deg'],obs_new ['fieldDec_deg']-obs_new ['Dec_deg'], s=0.1, color='magenta', label='After applying circle footprint filter')
ax.set_ylabel('distance from field centre RA (deg)')
ax.set_xlabel('distance from field centre Dec (deg)')
plt.legend()
plt.show()
[15]:
object_sep_new = get_separation(obs_new['RA_deg'].values,
                            obs_new['Dec_deg'].values,
                            obs_new['fieldRA_deg'].values,
                            obs_new['fieldDec_deg'].values)
[16]:
fig, ax = plt.subplots(1, figsize=(10,10))
_ = ax.hist(object_sep_new, 100, color='plum')
ax.axvline(1.5, color='black', linestyle='--')
ax.set_xlabel('distance from field centre (deg)')
plt.show()